%20good%20version.png)
K12 360° Conversations: Equity Series, Part III

Insights into Equity through Data
Equity for digital learners goes beyond simply providing devices and reliable internet connection, although it is definitely at the crux of the issue during remote learning. Timely and accurate data can help point schools in the right direction. The core of the problem then becomes: how do we measure equity? Are we even asking the right questions?
- Who has access to the internet? Who doesn’t?
- Are we providing enough bandwidth for kids to participate fully?
- What other digital issues impact children’s ability to fully participate?
- Where do we need to refocus our resources to put all kids on equal footing?
- How do we address the needs of each student?
- Where do disparities exist?
- How can we help specialized populations?
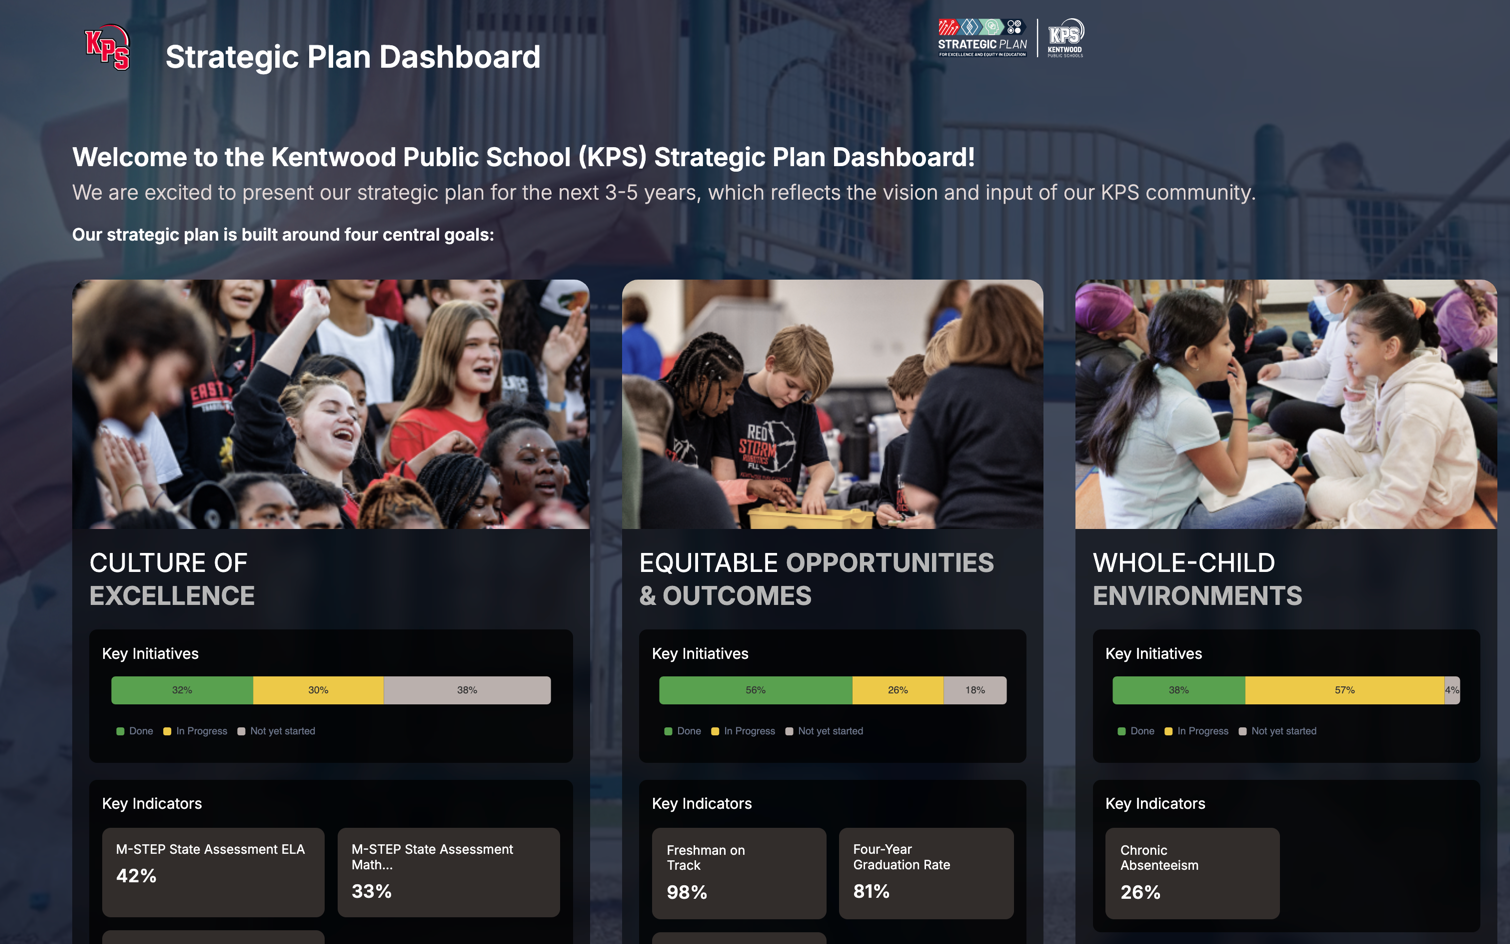
Currently, there are no ideal ed tech dashboards for measuring equity on the market. Our Remote Learning Dashboard provides indicators related to equity:
- Device distribution
- Device availability
- Student Outcomes
- Student Engagement
- Student Access
- College & Career Readiness
- Economically Disadvantaged
- Instruction Effectiveness
We can track what resources students, teachers, and staff are using (and not using) but it doesn’t answer the question of why. Are there barriers that need to be addressed, like language barriers, or lack of training? It is only then that we can begin to fine-tune a response plan that is affordable and scalable. Innive’s K12 360 Team adds some professional insight into Equity in the education industry:
We have moved into the Fourth industrial revolution. Access to and impact from digital resources is accelerating and informing us about practice. Students and families require high-speed, dependable internet access at home and in school. Without quality access, our students are left in the cold. Students that can engage are providing a wealth of information and data that can be used to inform, teachers, administrators, parents, and students of progress and insights. We have the typical data such as assessments and assignments but so much more: login times, length of time on lessons, progress through content, as well as collecting voice, video, and multimedia portfolios of student work.
The truth is that district and school needs are unique and cannot fit into a one-size-fits-all dashboard. On the other hand, educational technology has skyrocketed this year. Ed Tech companies like K12 360° have the design and technology capabilities to build out customized dashboards portraying usage that will help schools make crucial decisions for at-risk populations and individuals. But measuring equity is complex—what can we do? What can we advocate for as a community?
Up next on our K12 360° Conversations: To Achieve Educational Equity, Here’s What We Need to Do
Resources
K12 360° Conversations Equity Series:
- The Pandemic and Educational Equity
- Equity Through Community Coalitions
- Insights into Equity through Data
- To Achieve Educational Equity, Here’s What We Need to Do
K12 360° Conversations
We have an incredible team of experts at Innive who meet weekly to discuss current events and relevant subjects facing the education industry. The K12 360° Conversations are a blog series pulled from these conversations with the goal of providing an in-depth look at tough subjects and encouraging advocacy.