Enrollment Dashboard by Innive K12 360°

Make student movement clear—so you can act with confidence.

Enrollment Dashboard by Innive K12 360° - view enrollment metrics like Grade Retention Rate, Norm Day counts, Matriculation, and more.

Know Who’s Coming, Going, and Staying—Before It Catches You Off Guard

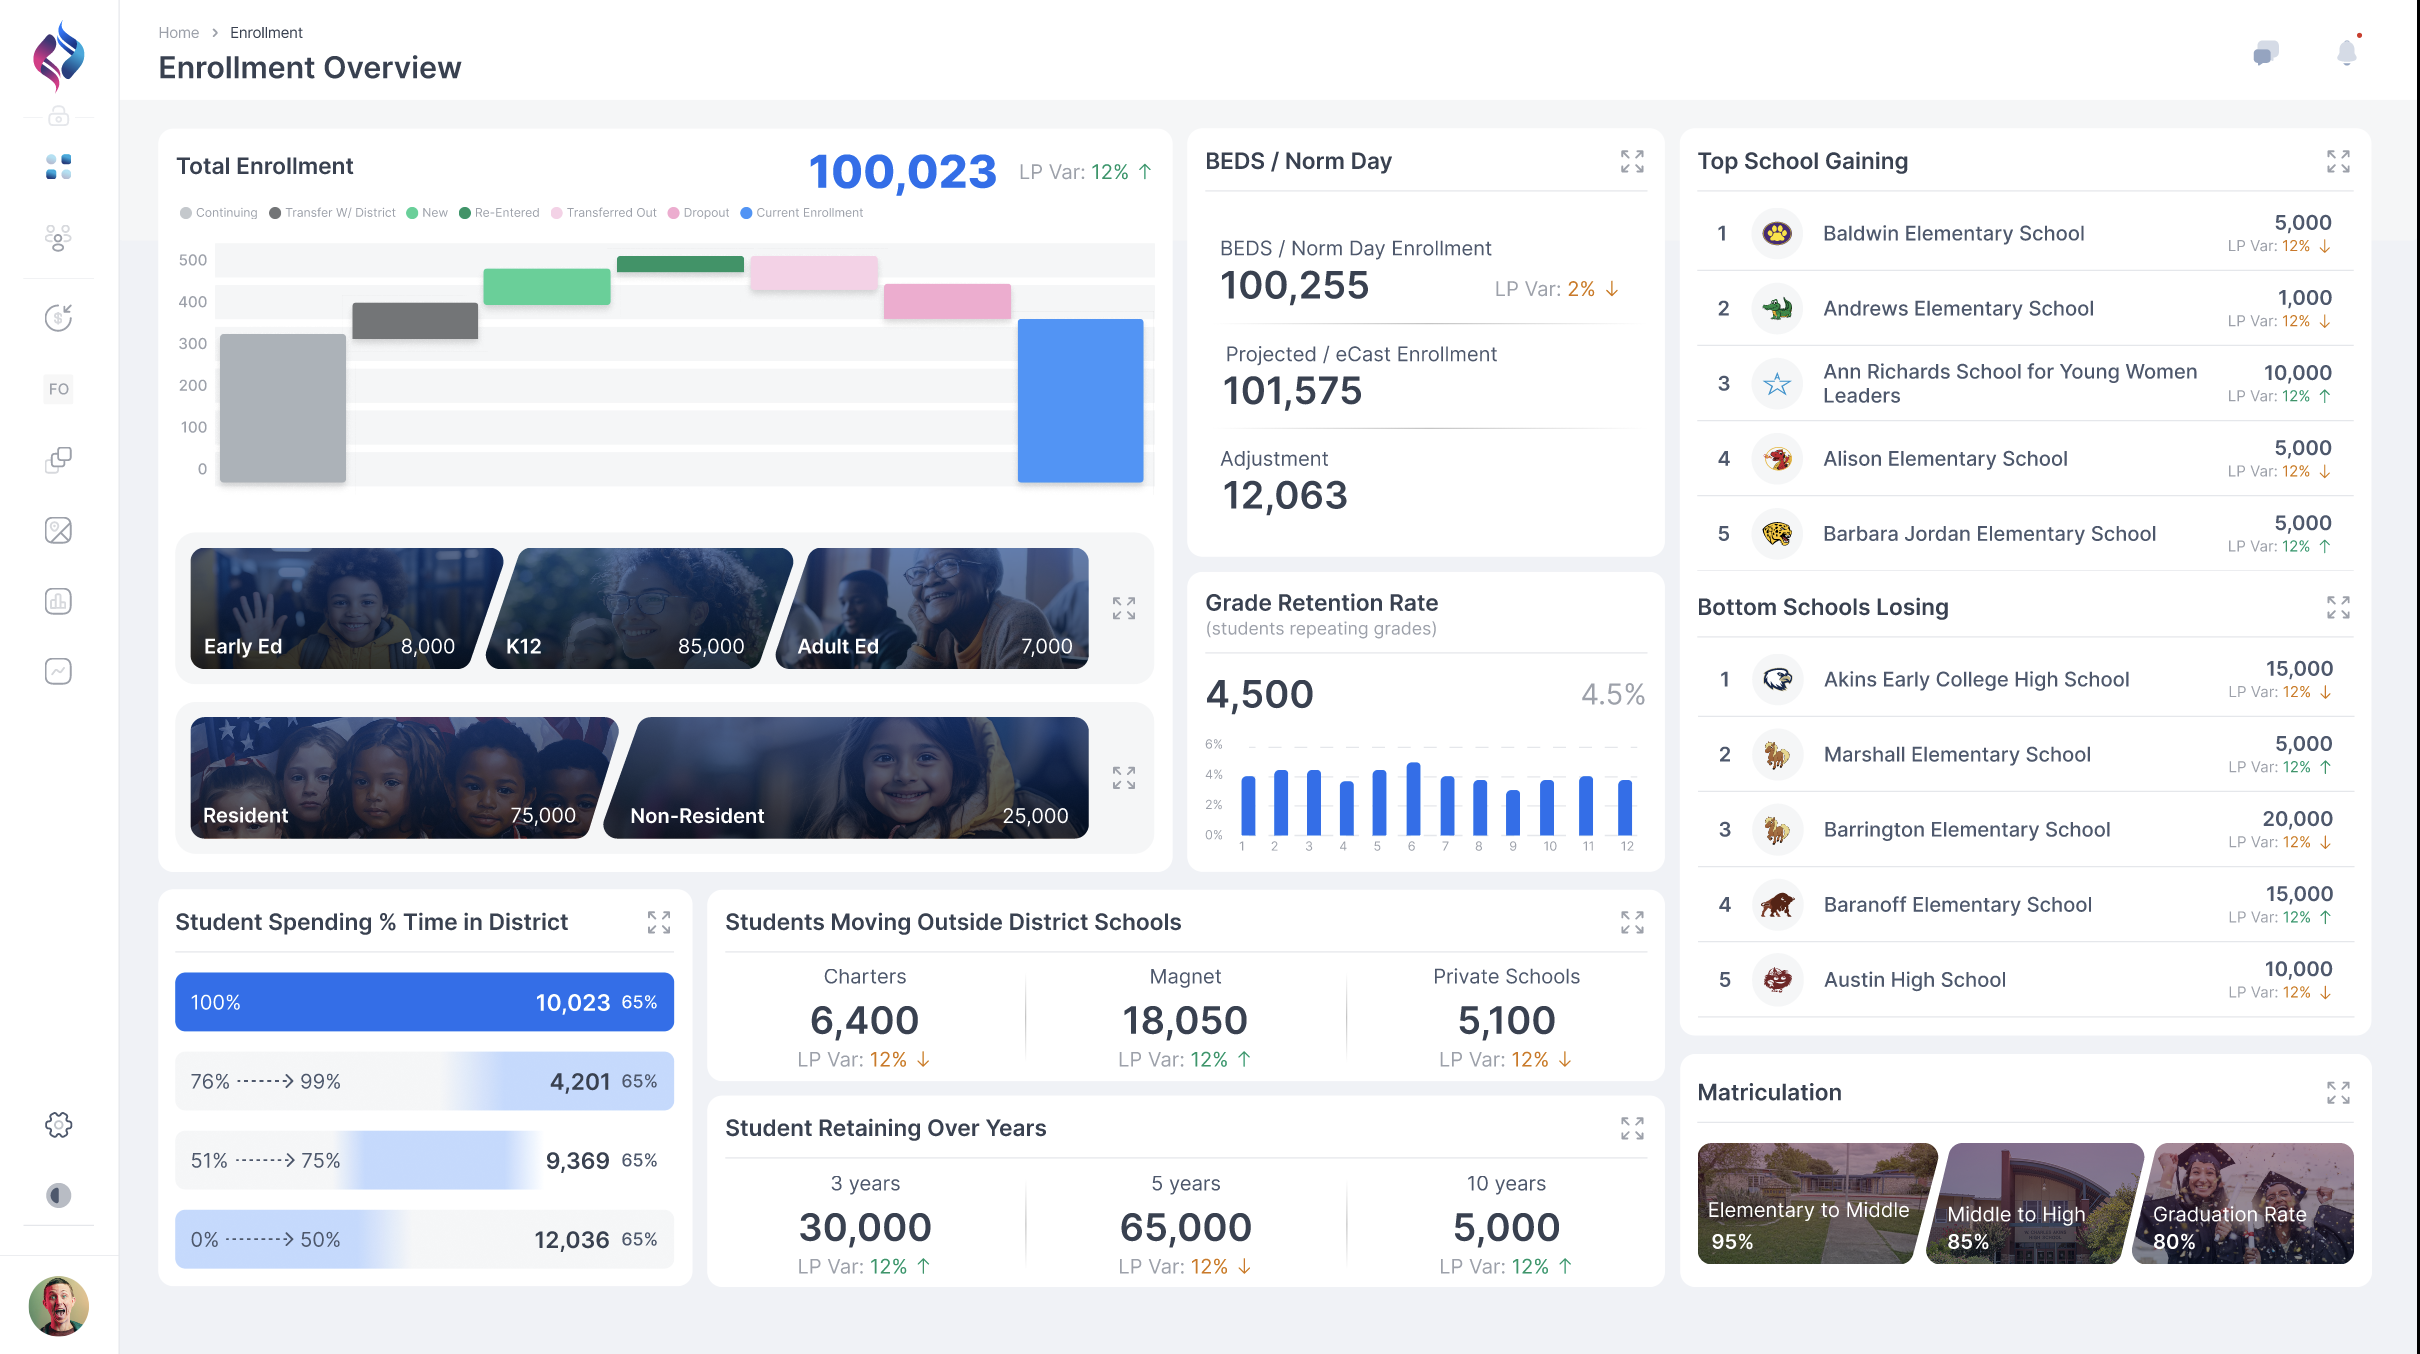
Whether you're planning staffing, managing capacity, or ensuring support for every student group, enrollment data plays a critical role in district decision-making.

The Enrollment Dashboard by Innive K12 360° gives you the full picture—real-time insights into student enrollment, building capacity, transfers, dropouts, and even projected shifts—so you're never caught reacting too late.

Screenshot from the Enrollment Dashboard by Innive showing student distribution across zip codes and population

Enrollment Intelligence

Keep a steady pulse on your student population.

Live Enrollment Tracking: Know exactly how many students are in your district, today.
Program Capacity: Understand who your students are and where there is space for them.
Trends Over Time: Spot enrollment patterns before they become challenges.
New Student Monitoring: See who new students are and what programming they may need.
Forecasting: Use built-in trend analytics to plan for what’s ahead.

Tracking Transitions

Because every student movement tells a story.

Transfer Tracking: Monitor movements in and out of your district—including where students go and why.
At-Risk Alerts: Combine movement data with attendance and academic indicators to flag students early.
Loss/Dropout Insights: Identify emerging patterns to address root causes and strengthen student retention.
Screenshot from the Enrollment Dashboard by Innive showing student spending % time in district and students moving outside district.
Screenshot of the Enrollment Dashboard showing geographic patterns and a school profile with enrollment data

Understand Population Dynamics

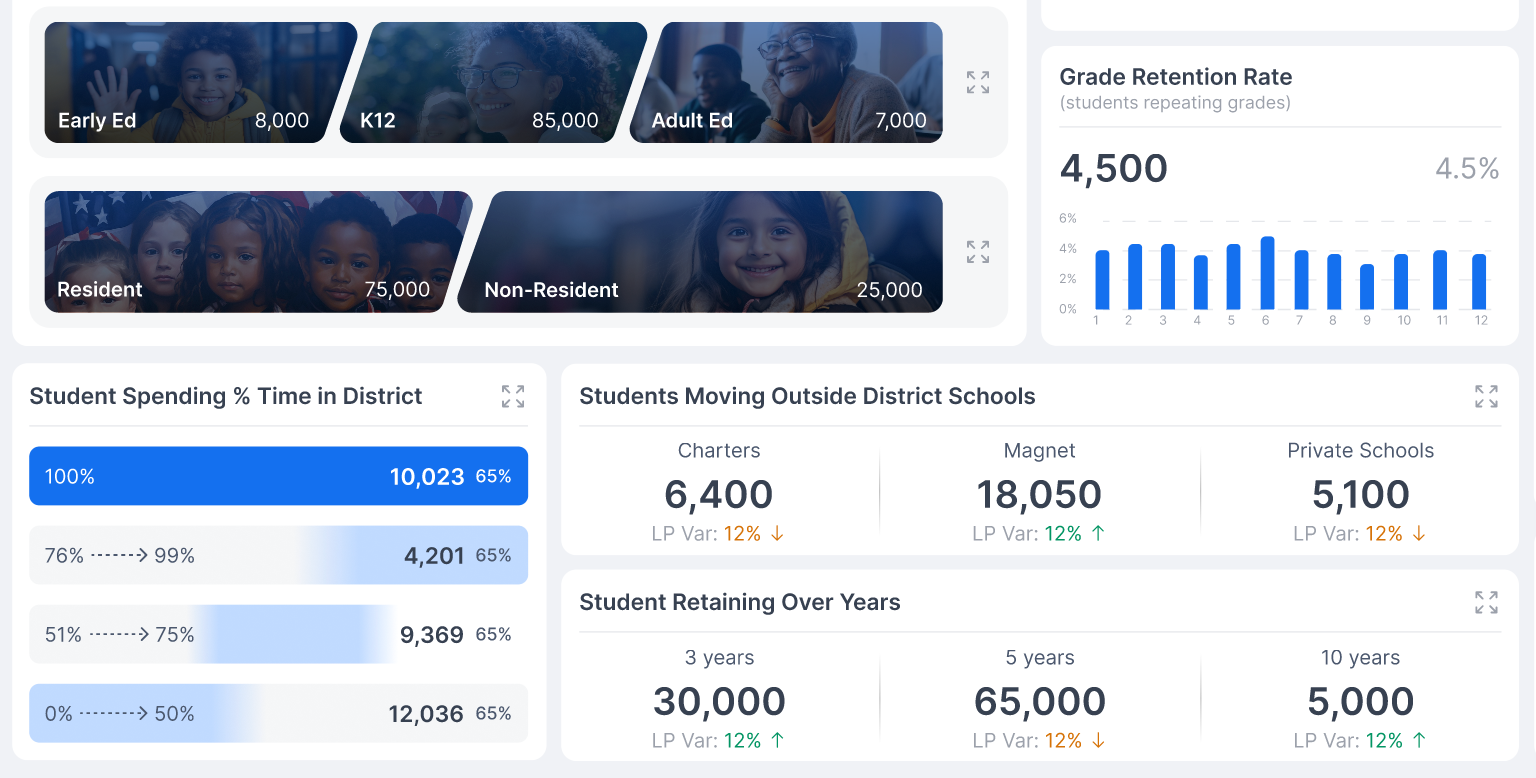
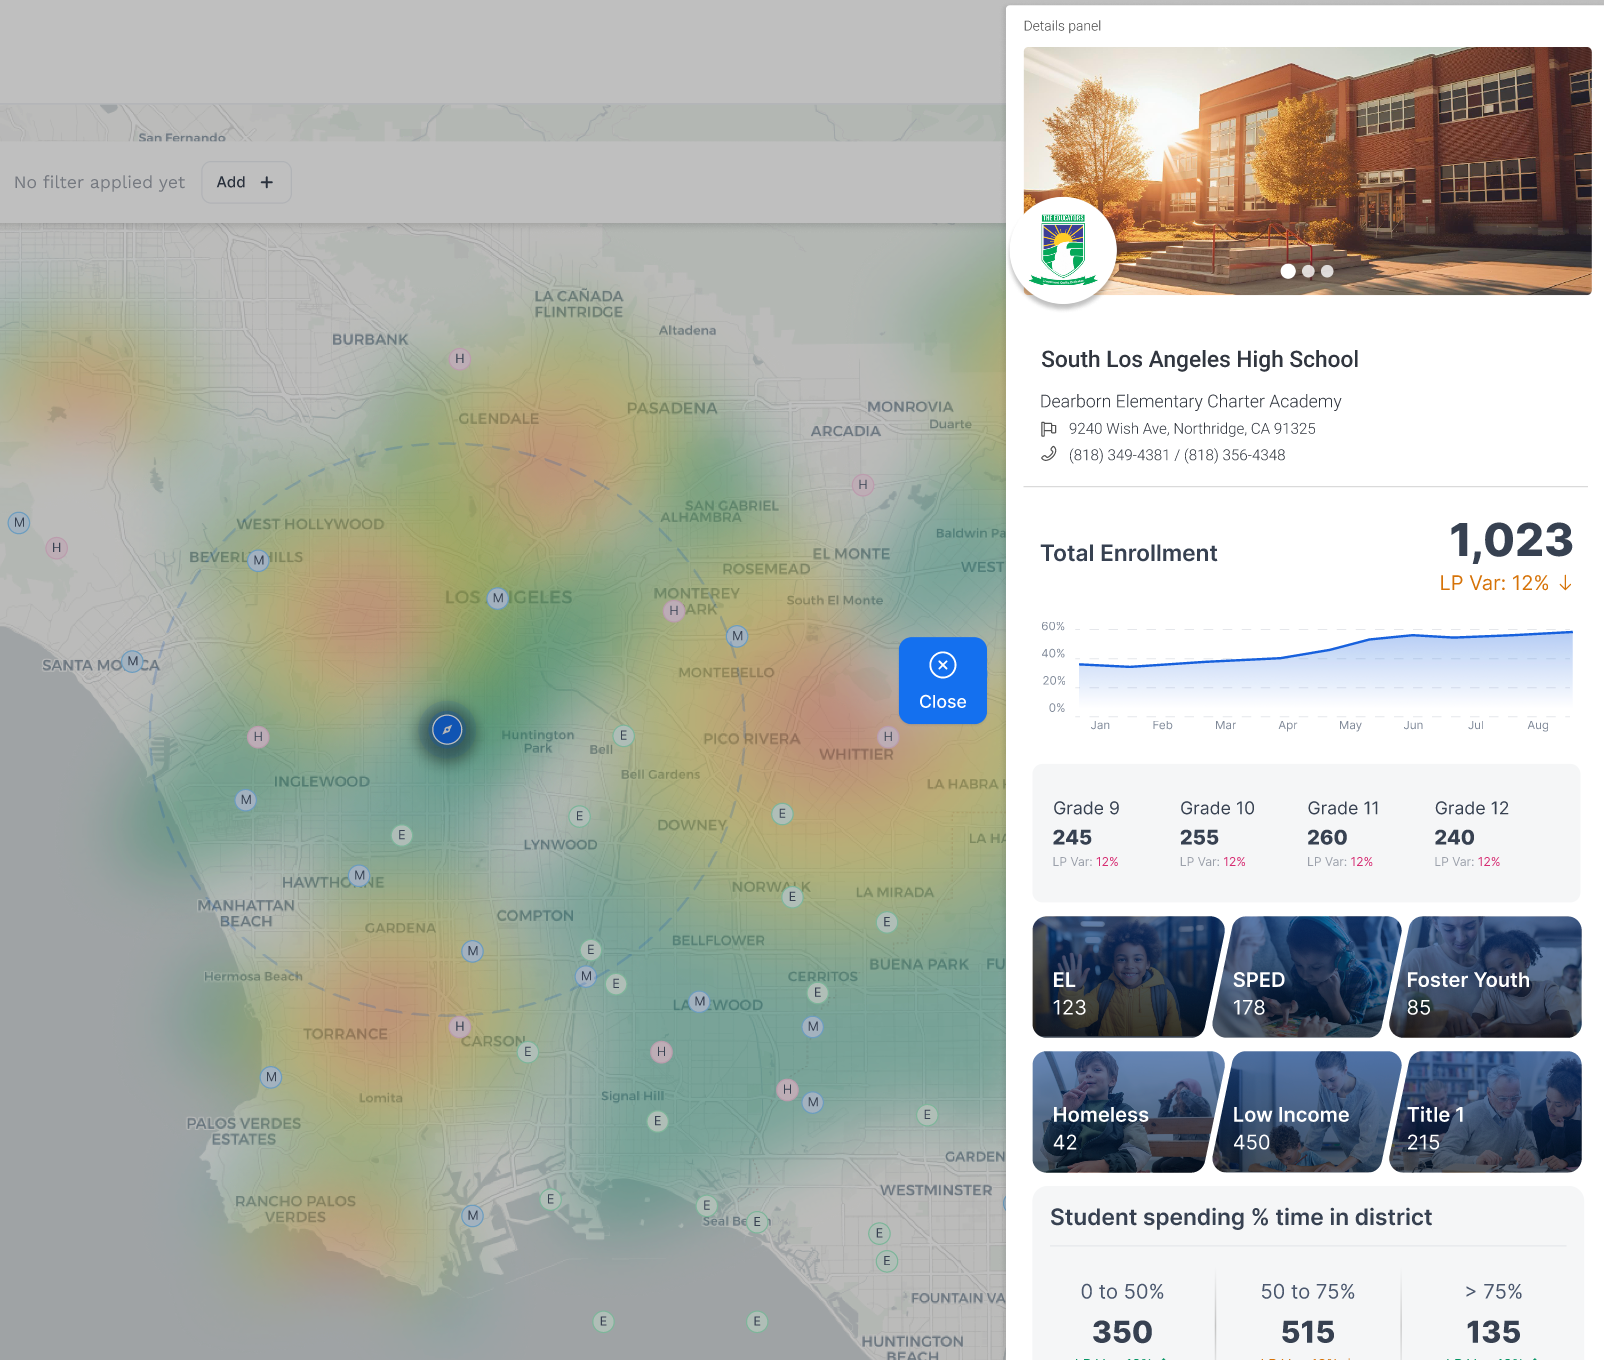
Make smarter, more inclusive decisions.

Conversion Metrics: Measure how interest becomes actual enrollment—by school, program, or zone.
Geographic Patterns: Identify which neighborhoods or zip codes are growing, declining, or under-engaged.
Equity-Focused Metrics: Use the Racial Disparity Index to highlight gaps and drive inclusive enrollment strategies.

Built for Your District, Not Just the Data Team

You don’t need to be a data expert to make data-informed decisions. The Enrollment Dashboard is designed for leaders who want answers—not endless spreadsheets.

Customize your metrics. Connect it to your existing systems. Get the insights you need, when you need them—so you can stay focused on what matters most: your students.