
%20good%20version.png)
CAOs Reporting Capability Impact Student Outcomes
A quick summary for the busy administrator!
- Fragmented data slows action: CAOs juggle academic, behavioral, and equity data across disconnected systems.
- Innive K12 360° transforms insights: Live, interoperable dashboards replace static reports with real-time insight. Greece Central School District shares how!
- Whole Child Analytics reveals patterns: Unified data from SIS, behavior, and academics uncovers the “why” behind performance.
- Dashboards turn insight into impact: District 360, Digital Equity, and P20 dashboards help CAOs act fast and drive student success.
Every day, a Chief Academic Officer wades through a flood of data. Attendance reports, test results, intervention logs, behavior notes, teacher feedback, and technology usage numbers need to be sorted through. Each report tells a part of the story, but never the whole thing.
The day brings questions. A meeting requires reading scores, and another wants attendance trends. A question is asked about equity in device access, followed by requests for updates on college readiness. The reporting needs are endless.
Data Disconnect
Districts collect enough data for the CAO, but it lives in separate locations. Grades in one system, attendance in another, and social/emotional data is somewhere else entirely. The CAO and team spends hours processing reports to answer a “simple” question: Why are our students falling behind?
In order to come to an answer, often an outside contractor or many hours of manual labor is required costing precious resources. By the time one static report is complete, the moment for action often has passed.
The Ease of LIVE Reports with Innive K12 360°
Districts spend enormous resources creating single static reports that are outdated almost as soon as they are finished.
With Innive K12 360°, that cycle ends. Instead of paying for one report at a time, districts gain a living interoperable dashboard. The investment that once produced one out-of-date static report instead delivers unlimited, real-time views into attendance, performance, and engagement. (Plus, tech teams love our product too!)
Live reports are not just efficient; they are transformational. District leaders can explore, compare, and act instantly without waiting for the next report or request. Innive K12 360° turns reporting from a recurring cost into a lasting system of clarity and strategy.
Actionable Data with Whole Child Analytics
Districts that have used Whole Child Analytics report a shift in how they process “learning.” Instead of exploring attendance, behavior, and academics in silos, Whole Child Analytics pulls everything together. When data connects, patterns appear. For example, leaders might be able to flag that a dip in grades was linked to missed days or stress at home.
By integrating information from SIS, Google Classroom, and IEP systems, Greece Central School District and Innive K12 360° eliminated data silos and gave cabinet leaders real-time insight to make faster, evidence-based instructional decisions.
Information into Action
Innive K12 360 built several tools alongside Whole Child Analytics that provide live reporting to districts.
- The District 360 Executive Dashboard gives a live view of academic goals across schools and subjects so CAOs can track progress and act quickly.
- The Digital Equity Dashboard helps leaders see where students still lack internet or devices, allowing them to close access gaps that affect learning
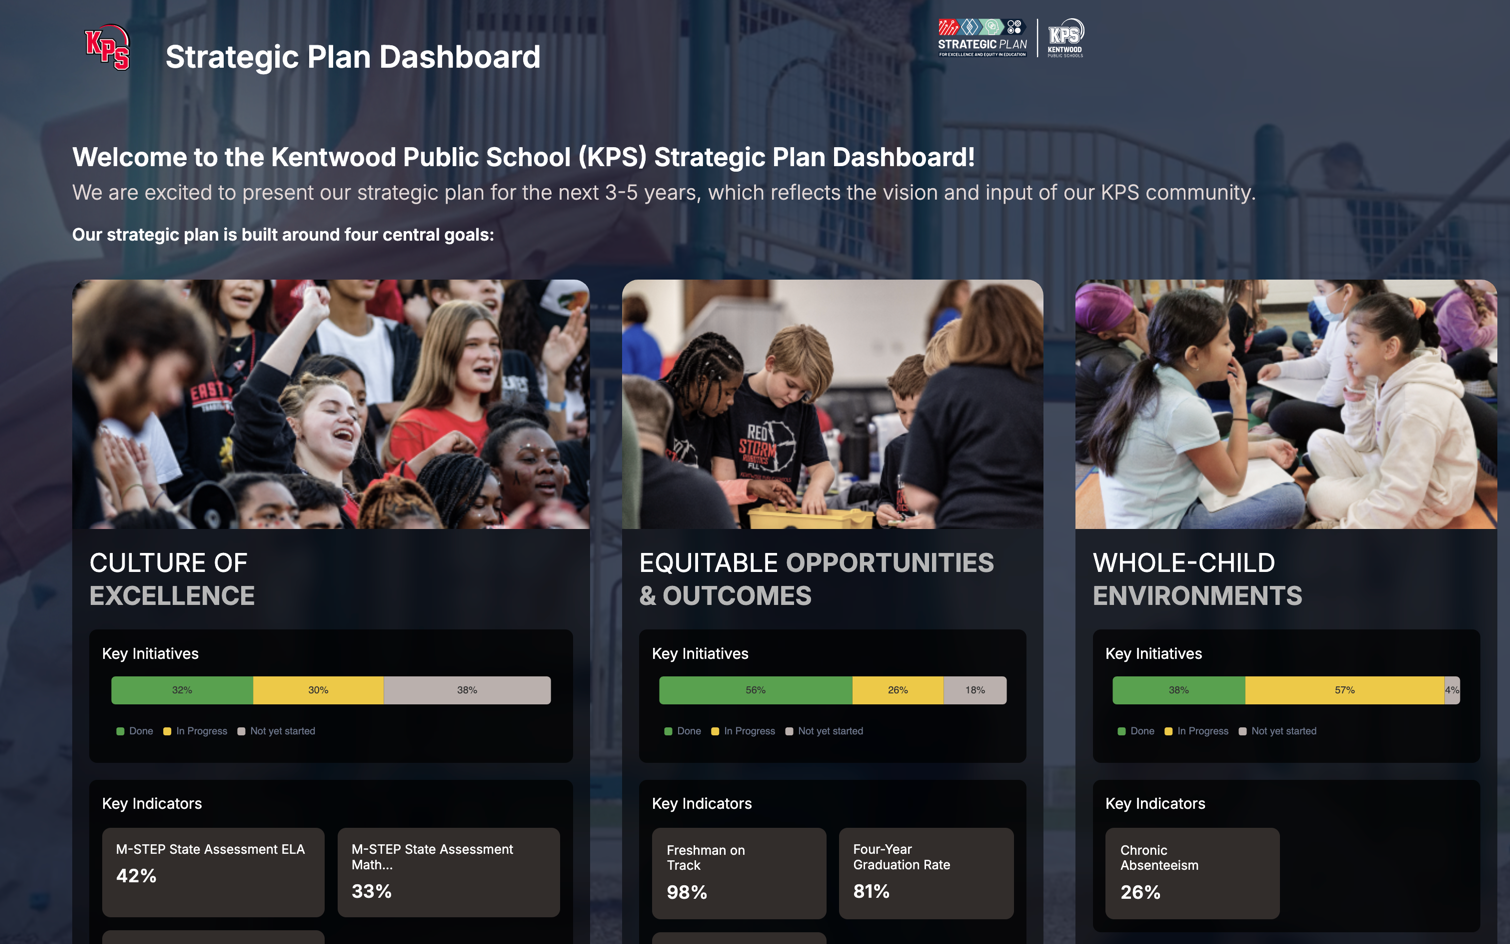
- The P20 Strategic Plan Dashboard connects daily academic work to long-term district goals, helping CAOs align current efforts with the district’s broader vision for student success.
These tools replace endless sorting and guessing with clarity and direction letting CAOs prioritize the most important decisions.
Innive K12 360° turns information into action and helps districts shift from reacting to challenges to shaping the future of learning.
