%20good%20version.png)
5 Ways Whole Child Analytics Helps You Prepare for Your Next Board Meeting
5 Ways Whole Child Analytics Helps You Prepare for Your Next Board Meeting
When the school board meets, district leaders are expected to bring clarity, transparency, and solutions to some of the toughest questions in education. From chronic absenteeism to student well-being, the pressure is on to provide clear evidence of progress and a plan for success.
Whole Child Analytics helps district leaders go beyond raw numbers to present a clear, actionable story. With role-based dashboards and strategic goal alignment, you’ll walk into your next board meeting ready to answer tough questions with confidence.
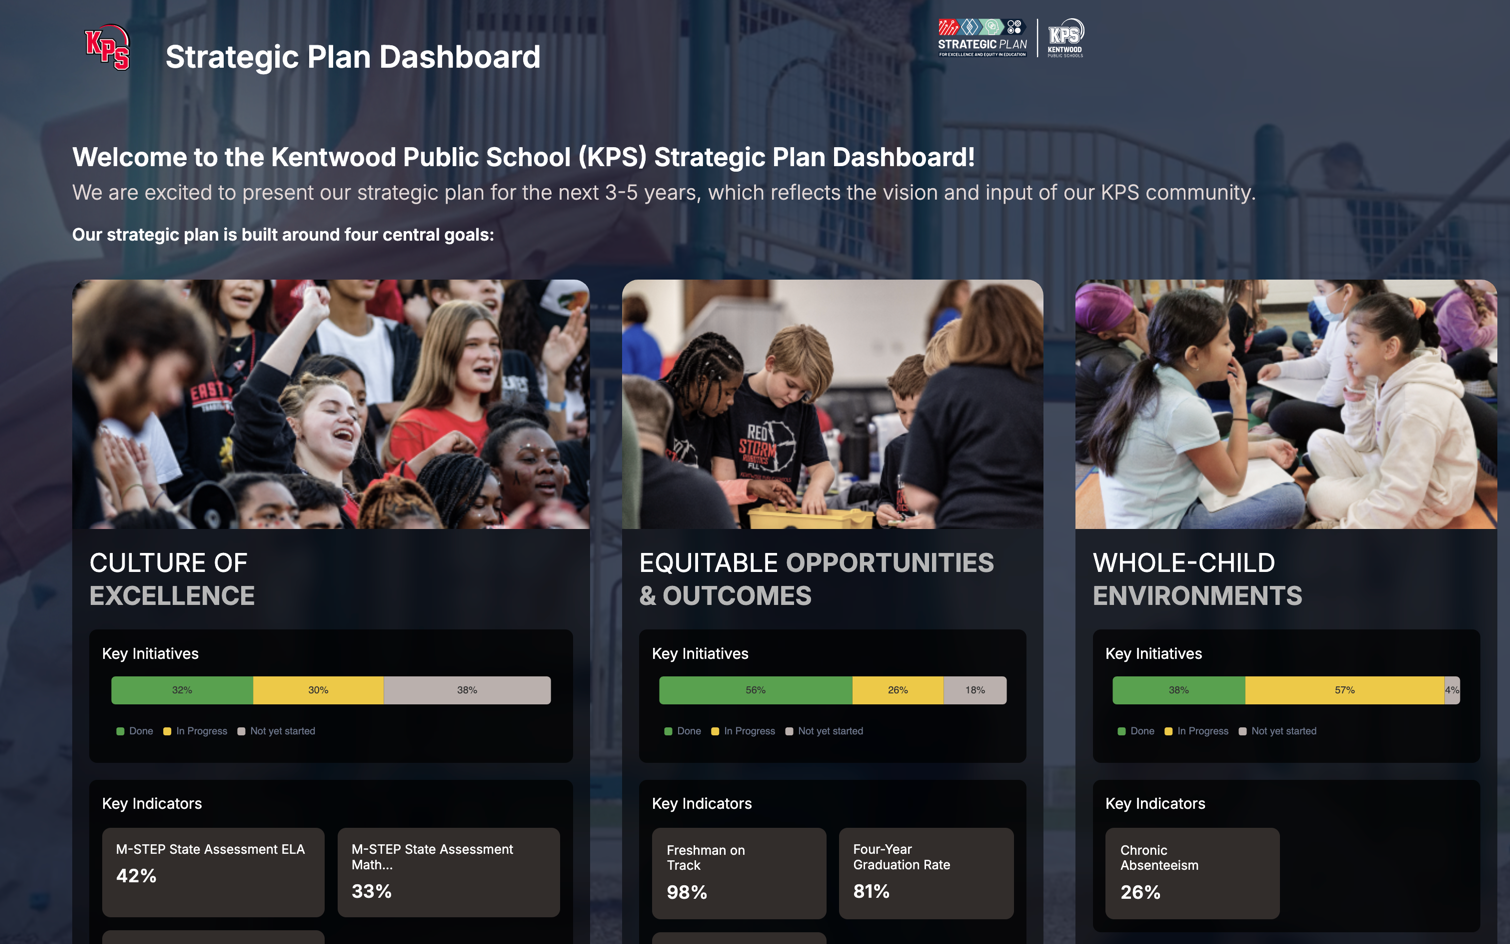
1. Align Student Data With Strategic District Goals
Board members want to know: Are we meeting the goals we set? Whole Child Analytics lets you map academic, behavioral, SEL, and attendance indicators directly to your district’s strategic plan. Instead of generic reports, you can show progress toward specific goals like improving graduation rates, reducing chronic absenteeism, or strengthening student belonging.
Tip: Use dashboards that align KPIs with board-approved goals to keep the conversation focused and transparent.
2. Use Role-Based Dashboards for Clearer Presentations
Superintendents, board members, principals, and counselors all need data—but not in the same way. Whole Child Analytics provides dashboards tailored to each role, so you can present the right level of detail for your audience.
Tip: When preparing for a board meeting, rely on superintendent-level dashboards that offer big-picture trends, while keeping school-level and subgroup detail in reserve for follow-up questions.
3. Answer Tough Questions About Student Success With Confidence
Questions about discipline disproportionality, chronic absenteeism, or declining test scores can be tough if you’re only looking at surface data. Whole Child Analytics integrates multiple data streams, so you can explain why trends are happening and what interventions are in place.
Tip: Pair student outcome data (test scores, attendance) with whole child insights (behavior, SEL, demographic data) to show root causes and responsive action.
4. Show the Impact of Interventions Over Time
Boards want to see more than plans—they want proof. Whole Child Analytics tracks interventions across MTSS, SEL initiatives, or attendance programs so you can demonstrate whether strategies are working.
Tip: Highlight year-over-year or semester-over-semester changes tied to specific initiatives to show impact with evidence.
5. Build Trust With Your Board and Community Through Transparency
When board members, families, and the community see clear, consistent reporting, confidence grows. Whole Child Analytics makes it easy to share data stories in ways that are accessible and actionable.
Tip: Use visuals from dashboards that highlight progress and challenges openly—demonstrating accountability while reinforcing your commitment to success for all students.
Walking into a board meeting without the right data is stressful. Whole Child Analytics equips you with role-based dashboards, goal-aligned reporting, and holistic student insights—so you can present with confidence, answer tough questions, and keep the focus on helping every learner thrive.
Ready to see how this works in practice? Read our latest case study to learn how one district used Whole Child Analytics to drive meaningful conversations at the board level.